In this post i would like to explain about how to create php charts using the Google API key. It is very simple to implement with few files.I have explained with demo.
The chart like this one:
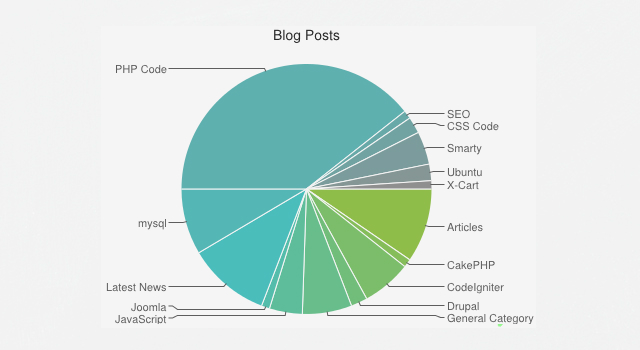
PHP charts with using Google API by Anil Kumar Panigrahi

|

|
To set the chart :
1 2 3 4 5 6 7 8 |
To set the colors:
1 2 3 4 5 6 |
Supported Graphs:
1) Pie Charts
2) Bar graph
3) Timeline Graph
Just put the following php code where we have to place the chart.
1 2 3 4 5 6 7 8 9 10 11 |
It displays the chart.
We can manage the occupation from the “$data” feild.
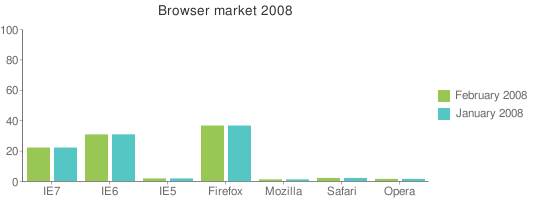
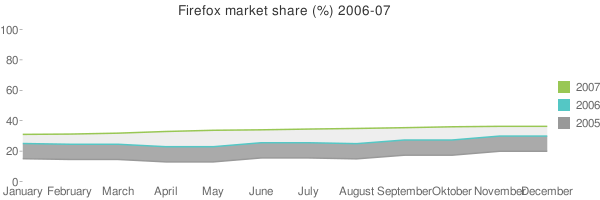
It is very nice to implement in the our sites.






4 Comments
Andre · April 7, 2009 at 1:23 pm
This is very useful, thank you!
chris · July 10, 2009 at 8:57 am
how to do horizontal bar graph?
anil2u · July 10, 2009 at 9:11 am
Hello Chris,
There is another option called set the variable to $dataMultiple ,
and called that variable at
$chart->setChartAttrs( array(
‘type’ => ‘bar-horizontal’,
‘data’ => $dataMultiple,
.
.
));
Then it will give the horizontal graph also.
Thank you.
Suresh · July 4, 2010 at 5:26 pm
Wow!!!, it’s really nice…